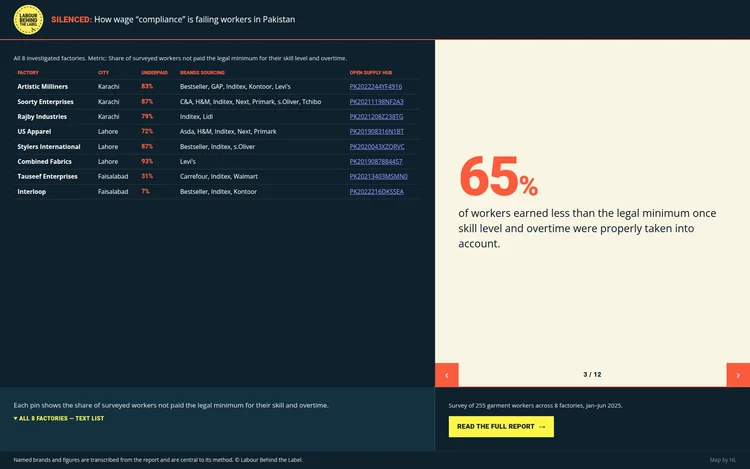
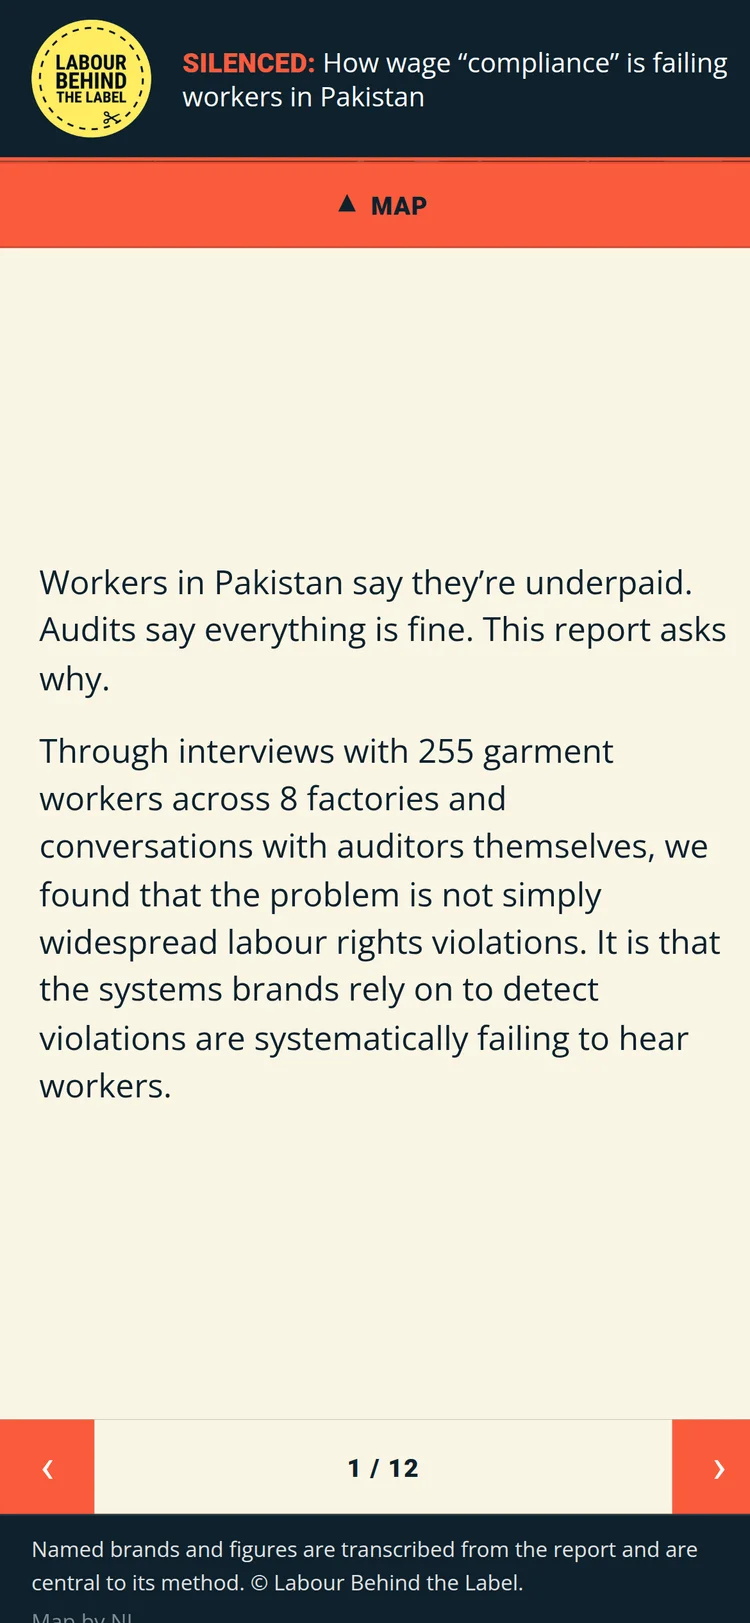
Labour rights charity Labour Behind the Label hired me to create a quick visualization deck to accompany their new working conditions audit report in Pakistan. The report, “Silenced,” surveyed 255 garment workers across 8 export factories to investigate why wage violations persist even where formal social-auditing programmes are in place, and I was tasked with turning its headline findings into a compact, embeddable infographic rather than another static PDF.
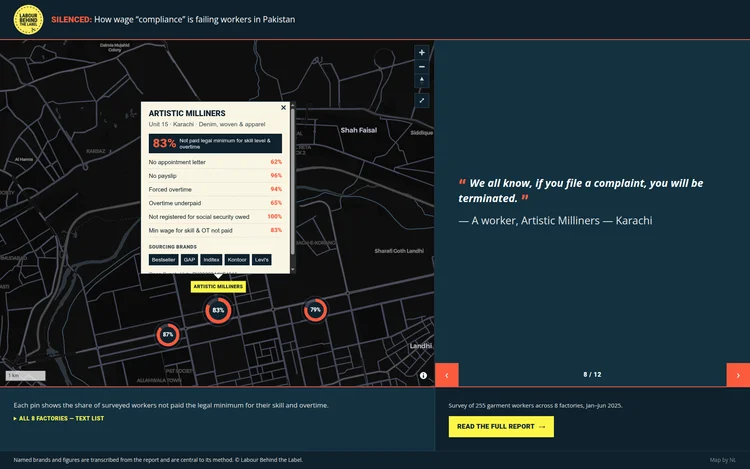
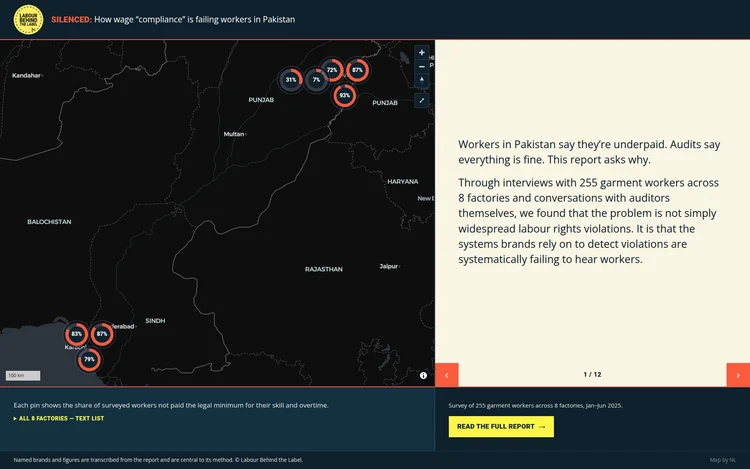
The centrepiece is a freely navigable map giving each of the 8 factories a real, geolocated pin, cross-referenced against Open Supply Hub and satellite imagery so viewers could see these as specific, real places tied to named global brands rather than an abstract “somewhere in Asia.” Each pin carries a small stat-visualization marker, and opens into a popup with the fuller per-factory picture: a headline stat, a breakdown of violation rates, sourcing brands as text chips, and the brand’s response status, all laid out as a compact visual stat block rather than a wall of text. Where factories sit close enough on screen to overlap, such as three clustered around Lahore, the markers regroup themselves into a compact grid tile rather than hiding behind each other or collapsing into a generic “+N” bubble — every pin stays visible, and clicking the tile zooms in until the group separates enough to select one directly. Alongside the map, a rotating card panel interleaves the report’s key statistics with anonymised worker testimony, preserving the dignity-and-anonymity convention the report itself uses.
The result is a single, small, self-contained HTML file — built with Vite and MapLibre GL JS, CDN-loaded with pinned versions and SRI hashes to keep the footprint minimal — designed to be dropped straight into an iframe on the charity’s WordPress site. It was built mobile-first with scroll-snap panel behaviour and full keyboard/screen-reader accessibility, so the map’s data is never locked away from users who can’t interact with the canvas directly.